Multi-Wavelength Solar Explorer
Switch between ultraviolet wavelengths and a magnetogram from NASA's Solar Dynamics Observatory to see coronal holes, flaring regions, prominences and magnetic active regions, or wipe between any two views to compare them.
Kp index
1.3
NOAA SWPC, Nov 5, 2026, 09:00 UTC
X-ray flux (GOES)
B6.8
NOAA SWPC, Nov 5, 2026, 13:00 UTC
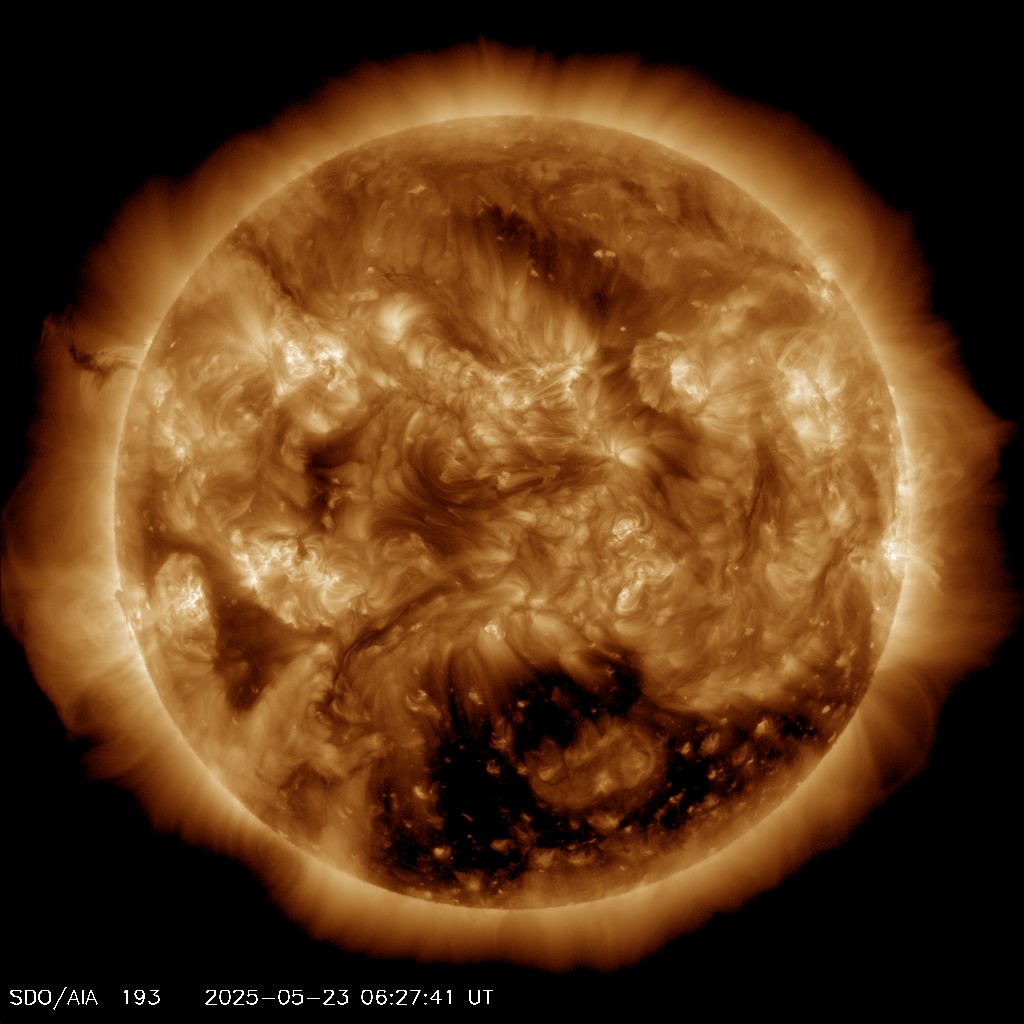
AIA 193 Å (extreme ultraviolet)
Coronal holes and the hot corona
Shows the Sun's outer atmosphere at about 1.2 million K and flares at about 20 million K. Coronal holes appear as dark patches: open magnetic field where fast solar wind escapes, a common driver of geomagnetic activity at Earth.
Observed Nov 5, 2026, 12:02 UTC (SDO frame time via Helioviewer)
Images: NASA Solar Dynamics Observatory (SDO) latest 1024px frames, refreshed by NASA every few minutes. The time shown is the observation time of the closest Helioviewer SDO frame, not the time this page loaded; it can differ by a few minutes from the image displayed. Kp and X-ray readings are from NOAA SWPC.
For live flare, sunspot and CME tracking see the Solar Storm Tracker.