1 · The Sun
Is the Sun throwing energy our way?
Low
The strongest flare in the last 24 hours was C2.2. Flares travel at light speed and reach Earth in about eight minutes.
LIVE TELEMETRY · NOAA SWPC & NASA
Live · Nov 5, 12:05 PM UTCReal-time tracking of solar wind, geomagnetic Kp, IMF Bz, solar flares and aurora conditions, with the time of every reading shown.
New to space weather? What does all this mean? Read the plain-language explainer.
Space weather right now
All calm
Verified NOAA readings show calm conditions. No storm, radiation or radio-blackout activity is in effect.
Explanations by Spaceweathertracker staff · Last reviewed · Editorial standards · About
How today's readings connect, from the Sun's surface to the sky above you.
1 · The Sun
Is the Sun throwing energy our way?
Low
The strongest flare in the last 24 hours was C2.2. Flares travel at light speed and reach Earth in about eight minutes.
2 · Earth
Is that energy reaching and shaking our magnetic field?
G0 — No storm
The interplanetary magnetic field is pointing northward (Bz 0.0 nT), which shields us. Current planetary Kp is 1.3.
3 · Your sky
Will anything be visible where you are?
Aurora possible above ~63° latitude
NOAA's model peaks at 21% overhead-aurora probability. Cloud cover and city light still decide whether you actually see it.
GOES X-ray flux, flare activity and the active regions producing it.
Solar flares can disrupt GPS accuracy, satellite links, and HF radio. X-class events cause the biggest blackouts; M-class may briefly degrade navigation.
Largest X-ray class · last 24 h
X-ray flux (GOES long)
Source: NOAA GOES
Flares in last 24h
Largest in 24 h: C2.2
Source: NOAA GOES X-ray
4 numbered sunspot regions on the Earth-facing disk. Larger, magnetically complex regions are the ones that produce strong flares.
| Region | Position | Area | Spots | McIntosh class | Magnetic class |
|---|---|---|---|---|---|
| 4564 | N03W14 | 30 µhem | 5 | DRO | B |
| 4565 | N15E08 | 80 µhem | 5 | DSI | B |
| 4566 | S06E40 | 120 µhem | 12 | FAI | BGDDelta configuration |
| 4567 | N17W41 | 10 µhem | 2 | CRO | B |
NOAA SWPC Solar Region Summary
NOAA's overall probability of at least one C-, M-, or X-class flare occurring anywhere on the visible solar disk, for each of the next forecast days below. This is a whole-disk forecast, not a prediction for any single active region.
| Day | C-class | M-class | X-class | Proton event |
|---|---|---|---|---|
| Wed, Nov 4 | 80% | 30% | 10% | 5% |
| Thu, Nov 5 | 85% | 35% | 10% | 5% |
| Fri, Nov 6 | 85% | 35% | 10% | 5% |
Source: NOAA SWPC
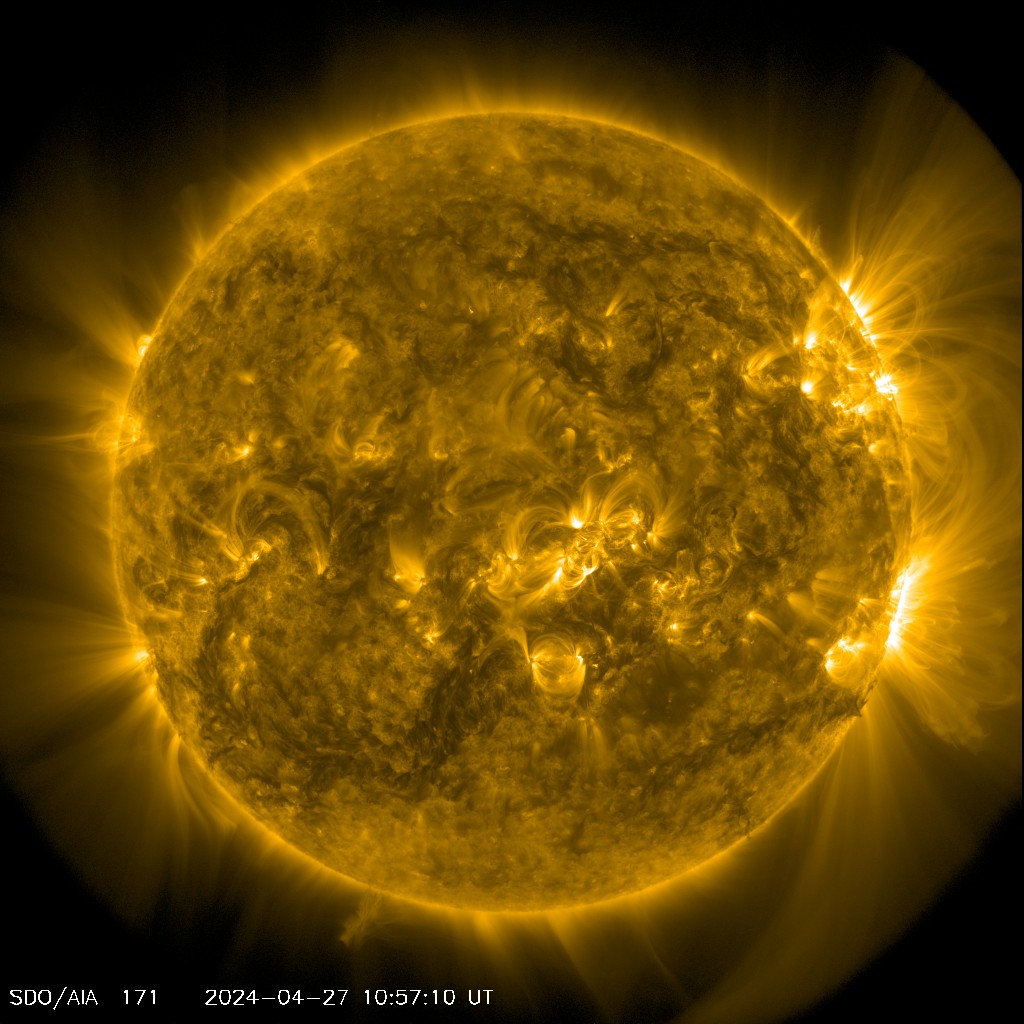
AIA 0171 • Magnetic Loops
NASA SDO · checking image time
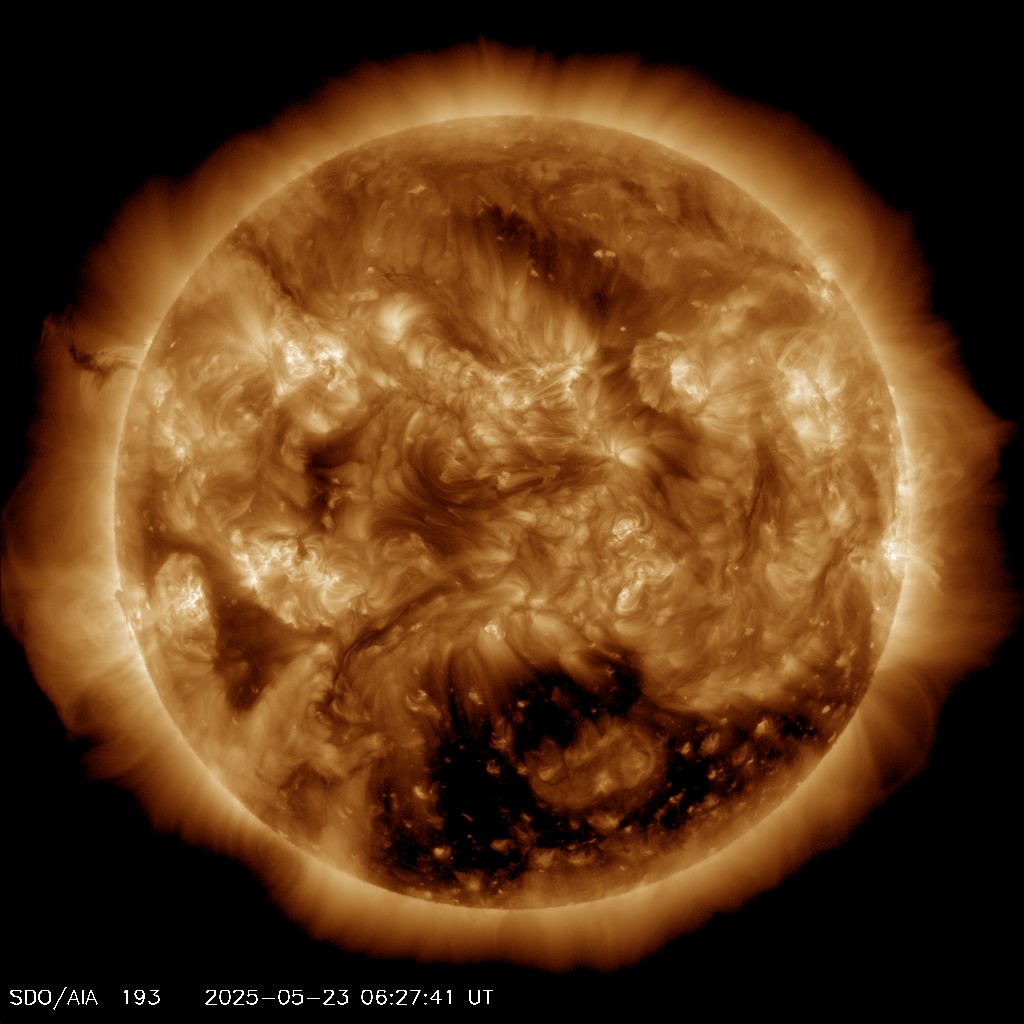
AIA 0193 • Coronal Holes
NASA SDO · checking image time
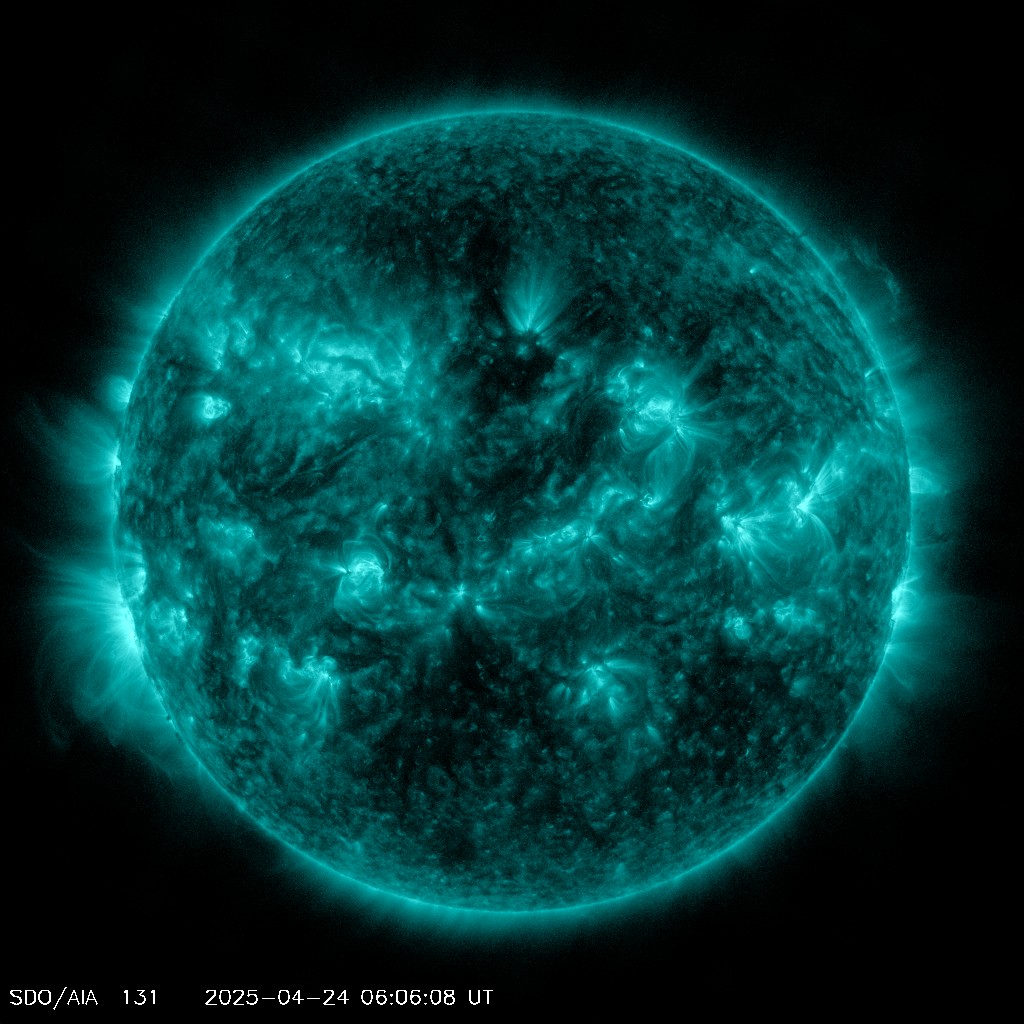
AIA 0131 • Solar Flares
NASA SDO · checking image time
Latest month (Oct 2026): 46. Highest so far this cycle: 216 (Aug 2024).
Monthly values, not live. The most recent months are preliminary. Source: NOAA SWPC observed solar-cycle indices. About the sunspot number
Real-time plasma and magnetometer telemetry from NOAA's L1 spacecraft.
Solar wind speed
Telemetry: SOLAR1 (NOAA SWPC)
Proton density
Telemetry: SOLAR1 (NOAA SWPC)
Plasma temperature
Telemetry: SOLAR1 (NOAA SWPC)
Moon Magnetotail Status
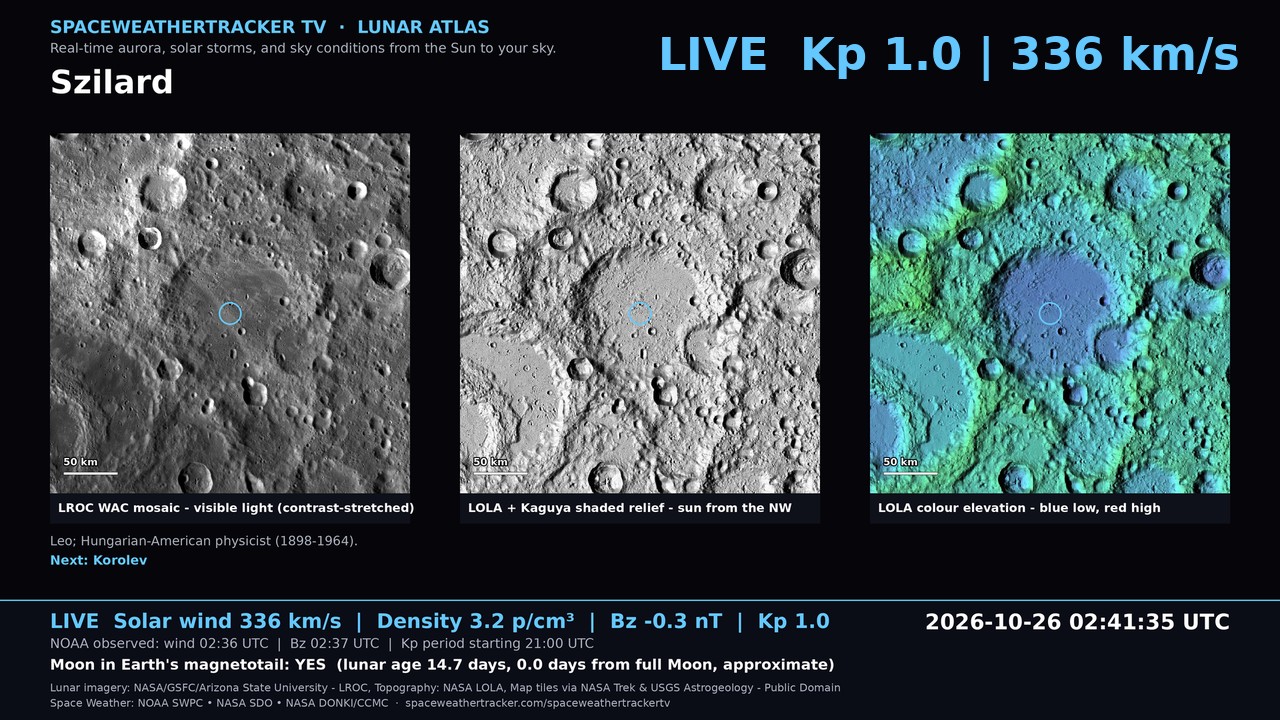
Live LROC + SWPC
NASA LRO · NOAA SWPC · lunar phase (approximate)
IMF Bz
Northward — shields Earth's field.
Telemetry: SOLAR1 (NOAA SWPC)
IMF Bt
Telemetry: SOLAR1 (NOAA SWPC)
Clock angle is the direction of the field in the Y–Z plane: 0° is due north (Bz positive) and 180° is due south (Bz negative). Angles near 180° favor energy entering Earth's magnetic field.
Reading from: Nov 5, 12:09 UTC · Source: NOAA SWPC real-time solar wind
NOAA SWPC · Telemetry: SOLAR1 (NOAA SWPC)· 5 Nov 12:05 UTC
NOAA SWPC WSA-Enlil model — how current solar wind structures are propagating toward Earth.
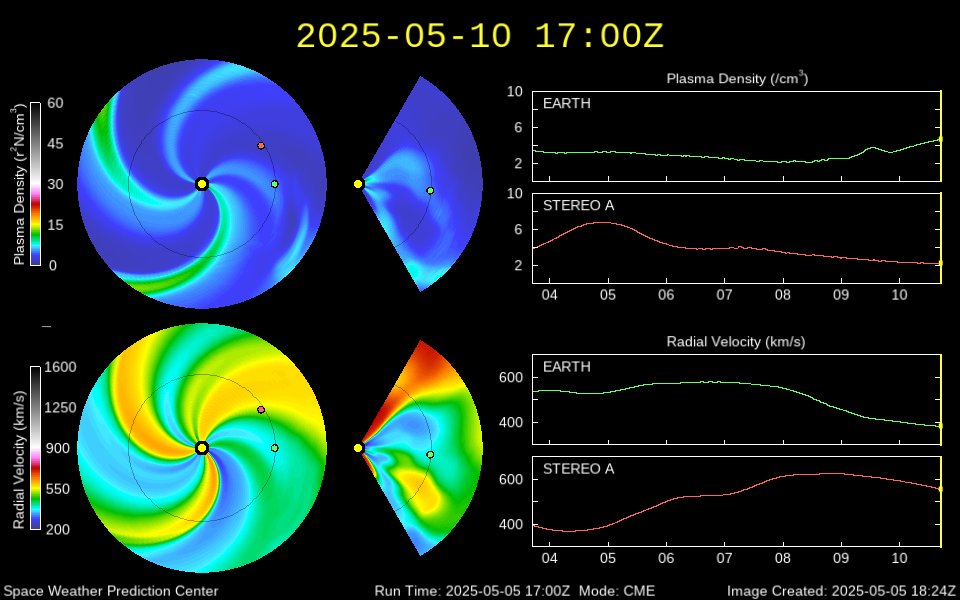
WSA-Enlil models how solar-wind structures and coronal mass ejections propagate from the Sun toward Earth, giving forecasters roughly 1–4 days of advance notice. This image comes directly from NOAA's Space Weather Prediction Center and updates on NOAA's own schedule — it is a model forecast, not a live real-time feed, and may reflect NOAA's most recent model run rather than the current instant.
Source: NOAA SWPC · View on spaceweather.gov
NOAA SWPC / USGS Boulder, Colorado ground magnetometer station.
Ground magnetometers measure changes in Earth's magnetic field at observatories on the ground. These measurements provide a direct view of how Earth's magnetic environment is responding locally. This chart shows the Boulder, Colorado station's own K-index — a single ground observatory, not a measurement of Earth's entire magnetic field.
Source: NOAA SWPC / USGS · Boulder, Colorado
NASA DONKI catalogue. Arrival estimates appear only where the Enlil model supplies one.
NASA DONKI / CCMC (Enlil model)
Planetary Kp index and NOAA's G-scale geomagnetic storm classification.
Measured: Planetary Kp 1.33
Quiet to unsettled geomagnetic conditions. No effects on power grids, GPS or radio.
NOAA SWPC planetary Kp· 5 Nov 09:00 UTC
Kp — last 9 three-hour readings
G-level history
Previous three-hour reading: Kp 1.67.
NOAA S-scale from GOES ≥10 MeV proton flux.
Measured: 0.22 pfu (protons ≥10 MeV)
Background radiation levels. No biological or satellite impact from solar protons.
NOAA GOES / SWPC· 5 Nov 12:10 UTC
Electron flux and higher-energy proton channels are not collected by this site's pipeline and are therefore not currently provided.
NOAA R-scale from GOES X-ray flux — the driver of shortwave blackouts.
Measured: 7.6 × 10⁻⁷ W/m² (GOES 0.1–0.8 nm)
No radio blackout. High-frequency radio and low-frequency navigation are operating normally.
NOAA GOES / SWPC· 5 Nov 12:10 UTC
What the geomagnetic conditions above mean for observers tonight.
Mean visibility probability, northern hemisphere (≥ 45° N)
Peak on grid: 21%
🔍 Forecast Analytics & Empirical Reasoning
Aurora Forecast Confidence: 50%
Solar Flare Forecast Confidence Tier: LOW (Reliability Index: 55% — driven by real NOAA Active Region magnetic complexity, no forecasted percentage exists for flares, only observed classification)
Geomagnetic Storm Confidence: Low (Based on L1 spacecraft to ground-magnetometer verification alignment)
• Factors Influencing Current Confidence: Baseline conditions — no elevated indicators currently active.
NOAA's OVATION model peaks at 21% overhead-aurora probability. With current Kp 1.3, aurora is plausible above roughly 63° geomagnetic latitude, given clear, dark skies.
NOAA OVATION model· 5 Nov 12:10 UTC
Forecast products, clearly separated from observations above.
NOAA SWPC 3-day Kp forecast (3-hour intervals)
| Date | 10.7 cm flux | Ap index | Largest Kp |
|---|---|---|---|
| 2026-11-02 | 95 | 10 | 3 |
| 2026-11-03 | 100 | 5 | 2 |
| 2026-11-04 | 100 | 5 | 2 |
| 2026-11-05 | 105 | 10 | 3 |
| 2026-11-06 | 110 | 10 | 3 |
| 2026-11-07 | 115 | 10 | 3 |
| 2026-11-08 | 115 | 5 | 2 |
| 2026-11-09 | 120 | 15 | 4 |
| 2026-11-10 | 115 | 10 | 3 |
| 2026-11-11 | 110 | 10 | 3 |
| 2026-11-12 | 110 | 10 | 3 |
| 2026-11-13 | 105 | 5 | 2 |
| 2026-11-14 | 105 | 5 | 2 |
| 2026-11-15 | 105 | 5 | 2 |
| 2026-11-16 | 100 | 10 | 3 |
| 2026-11-17 | 95 | 20 | 5 |
| 2026-11-18 | 95 | 20 | 5 |
| 2026-11-19 | 90 | 10 | 3 |
| 2026-11-20 | 90 | 5 | 2 |
| 2026-11-21 | 85 | 5 | 2 |
| 2026-11-22 | 85 | 5 | 2 |
| 2026-11-23 | 85 | 5 | 2 |
| 2026-11-24 | 90 | 5 | 2 |
| 2026-11-25 | 95 | 5 | 2 |
| 2026-11-26 | 95 | 10 | 3 |
| 2026-11-27 | 95 | 24 | 5 |
| 2026-11-28 | 95 | 20 | 5 |
A qualitative long-range outlook of solar radio flux, geomagnetic Ap and the largest expected Kp — useful for trend, not for precise day-by-day prediction.
NOAA SWPC 27-day outlook· 2 Nov 02:18 UTC
Source: NOAA SWPC
Observational imagery from SOLAR-1's Compact Coronagraph — not a forecast product.
Verified events only — flares, CMEs, geomagnetic and radio events, newest first.
Recent Space Weather Events
Coronal mass ejection at 497 km/s
Confirmed by: NASA DONKI
Coronal mass ejection at 350 km/s
Confirmed by: NASA DONKI
Coronal mass ejection at 309 km/s
Confirmed by: NASA DONKI
Coronal mass ejection at 357 km/s (Earth-directed)
Confirmed by: NASA DONKI
Coronal mass ejection at 894 km/s
Confirmed by: NASA DONKI
Coronal mass ejection at 345 km/s
Confirmed by: NASA DONKI
Coronal mass ejection at 218 km/s
Confirmed by: NASA DONKI
Coronal mass ejection at 287 km/s
Confirmed by: NASA DONKI
Coronal mass ejection at 329 km/s
Confirmed by: NASA DONKI
Coronal mass ejection at 399 km/s
Confirmed by: NASA DONKI
Coronal mass ejection at 302 km/s
Confirmed by: NASA DONKI
Coronal mass ejection at 260 km/s
Confirmed by: NASA DONKI
Coronal mass ejection at 280 km/s
Confirmed by: NASA DONKI
Coronal mass ejection at 616 km/s
Confirmed by: NASA DONKI
Coronal mass ejection at 681 km/s
Confirmed by: NASA DONKI
NOAA products currently in force. Expired and future-dated products are excluded.
Only storm-level events that are actually in force.
Nothing significant in force
NOAA's alert feed loaded successfully and contains no storm-level warnings, watches or radiation events currently in effect.
Every product NOAA SWPC has issued recently — including minor and expired ones. 0 minor in force · 84 expired.
Issued 04 Nov 2026 19:04 UTC · A20F
Issued 04 Nov 2026 14:47 UTC · EF3A
Issued 04 Nov 2026 08:19 UTC · K04W
Issued 03 Nov 2026 05:02 UTC · EF3A
Issued 02 Nov 2026 12:03 UTC · EF3A
NOAA SWPC — Kp index and forecast, solar wind plasma, IMF, X-ray flux, proton flux, solar region summary, OVATION aurora model, alerts, 27-day outlook.
NASA SDO — live solar imagery channels.
NASA DONKI / CCMC — coronal mass ejection catalogue and Enlil arrival modelling.
Last refresh: Nov 5, 12:05 PM UTC. Providers are polled server-side roughly every ten minutes and cached; your browser never calls NOAA or NASA directly. Where a reading is missing, this page says so rather than substituting a value — a missing value is not a quiet condition. Known gaps: IMF By and electron flux are not collected by this pipeline. The IMF Bx, By and clock-angle panel above is a separate live read of NOAA's solar-wind magnetometer product, not stored history. CCOR-2 imagery is now shown above, sourced from a real endpoint inferred from NOAA's confirmed CCOR-1 sibling structure — not independently verified live from this deployment environment.
Readings come from NOAA and NASA public feeds. The Kp panel shows the observation time of the newest NOAA value in UTC. NOAA's official Kp is built from three-hour intervals, while solar wind and GOES X-ray flux are published far more often, with some NOAA plots updating every minute.
G rates geomagnetic storms from Kp (G1 is Kp 5, G5 is Kp 9). S rates solar radiation storms from the flux of energetic protons above 10 MeV. R rates radio blackouts from GOES X-ray flux, starting at an M1 flare for R1 and an X1 flare for R3. Each runs from 1 (minor) to 5 (extreme).
When the interplanetary magnetic field points south (negative Bz), solar wind energy couples more efficiently into Earth's magnetic field, which is why forecasters watch it alongside solar wind speed. It does not guarantee a storm, because strength and duration matter too, but it is a key ingredient.
Flare light and X-rays reach Earth in about eight minutes, so radio effects are immediate. A coronal mass ejection travels as matter: the fastest Earth-directed ones arrive in roughly 15 to 18 hours and slower ones take several days. It causes a storm only if it is Earth-directed and its magnetic field connects with ours.
Real NASA, NOAA, and NSF photographs — a new set each day.